How to Track Craft Fair Inventory and Sales (Free Method + Template)
At the end of a market day most vendors know roughly how it went: busy, slow, "not bad". What's harder to know is what actually sold, what's left in the tubs, and whether the day made money once the booth fee and gas are taken out. A little tracking answers all three, and it doesn't need a point-of-sale subscription. This guide walks through a free method you can run with a notebook and any spreadsheet app.
Why bother tracking craft fair inventory and sales?
Tracking gives you three things you can't get from memory:
- What to make next. If one design sold out by noon and another came home untouched, that's your production plan for the next show.
- What to pack. Knowing what sold at a particular event helps you bring the right quantities next time instead of hauling everything.
- Which shows to book again. Two markets with the same sales can have very different results once you subtract fees, travel and the hours you spent. You can only compare them if you write the numbers down.
Step 1: Build a simple inventory list before the show
Start with one row per product (or per product variation that you price differently). For each one, record:
- Item name, short enough to write quickly on a tally sheet.
- Unit cost: what it costs you to make one, including materials and packaging. If you haven't worked this out yet, see how to price handmade products.
- Price: what you charge at the booth.
- Quantity packed: the number that actually goes in the car for this event, not your total stock at home.
Count as you pack, not the night before you pack. Counting at the moment items go into the tub is the only number you can trust later.
Step 2: Use a tally sheet at the booth
During a rush, nobody wants to type into a spreadsheet. A paper tally sheet is faster: list your items down the left, and make a mark each time one sells. Add a column for payment type (cash or card) if you want to check your totals against your card reader later.
A few habits make tally sheets more reliable:
- Keep the sheet on a clipboard in the same spot every time, near your payment area.
- Mark the sale when you take payment, not when the customer picks the item up.
- If you're sharing the booth with a helper, agree on one person (or one sheet) for marking sales.
- Note discounts or bundle deals next to the tally mark so the money adds up later.
If your card reader app lets you set up item buttons, you can use that as your tally for card sales. Cash sales still need marking by hand.
Step 3: Reconcile after the show
When you get home, before the tubs go back on the shelf, check your numbers three ways:
- Count what came back. For each item: quantity packed minus quantity returned equals quantity sold.
- Compare with your tally. If the tally says 12 sold and the count says 14, you have either a missed tally mark, a miscount, or a loss. A small difference is normal; a big one is worth looking into.
- Check the money. Card sales should match your reader's report for the day. For cash, count the box and subtract your starting float. The two together should roughly match your tally total.
Then update your stock at home: the starting quantity minus what sold gives you what's left to sell.
Step 4: Work out what the show really made
Revenue is the exciting number, but profit is the useful one. For each event, record:
- Revenue: total sales.
- Cost of goods sold: for each item, quantity sold × unit cost.
- Payment processing fees: use your card processor's actual fees from its report, not a guess.
- Booth fee, travel and other event costs (parking, a new tablecloth, a jury fee).
- Hours: count packing, driving, setup and teardown, not just selling hours.
Then the core formulas:
Profit = Revenue − Cost of goods − Processing fees − Booth fee − Travel − Other costsProfit per hour = Profit ÷ Total hoursBreak-even sales = Fixed event costs ÷ (1 − cost of goods % − processing %)
A worked example
Here's a made-up example to show the math. Suppose you sell candles that cost $3.50 each to make and sell for $14. The booth fee is $60, gas is $18, and your processor charges 3% (check your own rate). You sell 22 candles and spend 9 hours on the show in total.
| Line | Calculation | Amount |
|---|---|---|
| Revenue | 22 × $14 | $308.00 |
| Cost of goods | 22 × $3.50 | −$77.00 |
| Processing (3%) | $308 × 0.03 | −$9.24 |
| Booth + gas | $60 + $18 | −$78.00 |
| Profit | $143.76 | |
| Profit per hour | $143.76 ÷ 9 | about $15.97 |
Each candle leaves $10.08 after its own cost and fee ($14 − $3.50 − $0.42), so it takes $78 ÷ $10.08 ≈ 7.7, or 8 candles, just to cover the booth and gas. Everything after that is profit.
Want to run these numbers before you apply to a show? The free Is This Show Worth It? calculator does exactly this with your own estimates.
Setting up the free spreadsheet version
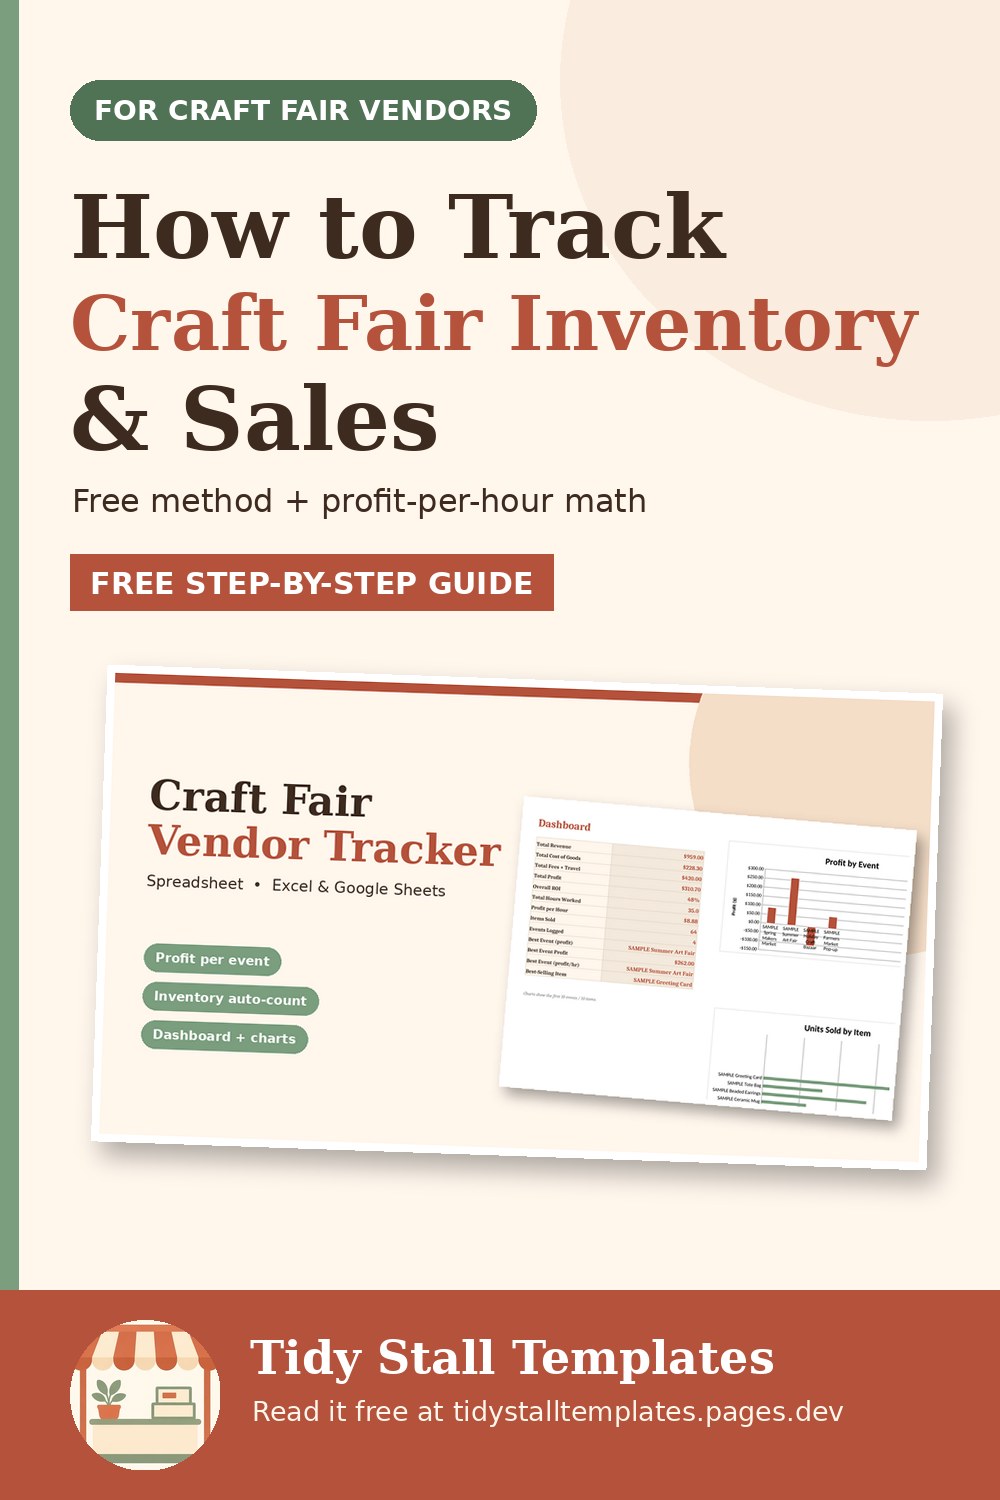
You can do all of this in Google Sheets, Excel or LibreOffice with three tabs:
- Inventory: Item, Unit cost, Price, Starting stock, Sold (sum from the Sales tab), Remaining (
Starting stock − Sold). - Sales: Event, Item, Quantity, Price, Payment method, Total (
Quantity × Price). - Events: Event name, Date, Booth fee, Travel, Other costs, Hours, then revenue and cost of goods pulled from the Sales tab with
SUMIFS, and the profit formulas above.
Type in your tally after each show, and the totals build up over a season. Use a SUMIFS like =SUMIFS(Sales!F:F, Sales!A:A, A2) to total sales for the event named in A2.
Common mistakes to avoid
- Leaving out your time. A show that looks profitable can work out to very little per hour once a long drive and setup are counted.
- Forgetting small costs. Bags, receipt paper and parking add up over a season.
- Judging a show on one day. Weather and timing vary. If you can, look at two or three visits before dropping a market for good.
- Waiting too long to reconcile. The longer the tubs sit, the harder it is to remember what happened.
Tracking doesn't have to be perfect to be useful. Even rough numbers, written down consistently, will tell you more about your markets than memory alone.